n8n Error Handling: Catch Failed, Stalled and Empty Workflows Before Anyone Else Does (+ Free Template)

Last tested on n8n 2.46, November 2026.
When an n8n node fails at 2am, the default behaviour is a red row in the execution list that nobody sees until something downstream breaks. Setting up an n8n error workflow fixes the noisy crashes, yet the failures that hurt most are the quiet ones where a schedule stops firing after a credential lapses or a supplier feed returns an empty file for a week and marks every run green. Most n8n error handling guides cover the crash and ignore the silence, while standalone schedule watchers can’t tell you when they break. By the end of this guide, you’ll have one monitoring workflow that catches crashes, stalls, bursts and empty runs, alerts once per outage, confirms recovery, and posts a morning all-clear.
What you’ll build
We’ll follow three scheduled workflows across an n8n instance: Import supplier feed (every 2 hours), Sync inventory (hourly) and Publish new products (weekdays at 9, cron 0 9 * * 1-5). When Import supplier feed hits a 503 error at its Do the work node, the monitor saves the failure and posts one Slack alert with the node name, the error and a direct link to the execution:

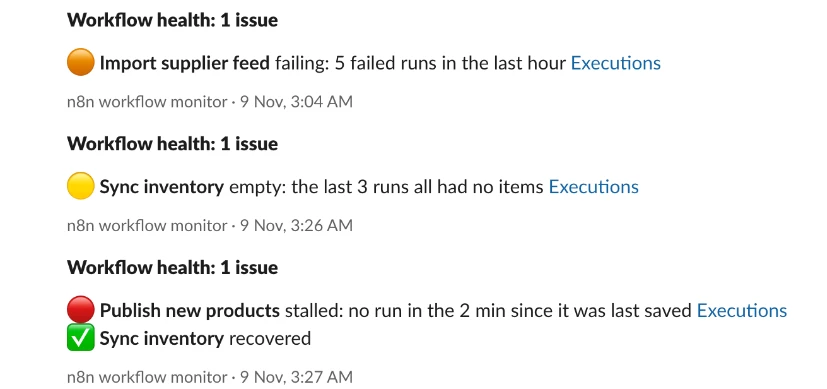
Every 15 minutes, the Watch lane checks the n8n API and your run logs to flag error bursts, runs that finished with zero items, schedules that missed their window, and workflows that have recovered:
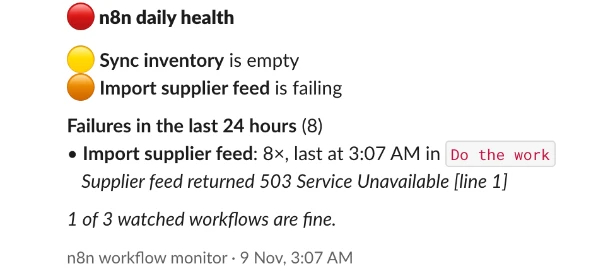
At 08:00 every morning, the Digest lane posts either a breakdown of active issues, recent failures and uncovered workflows, or a single all-clear line so you never have to guess whether silence means health or a dead monitor:

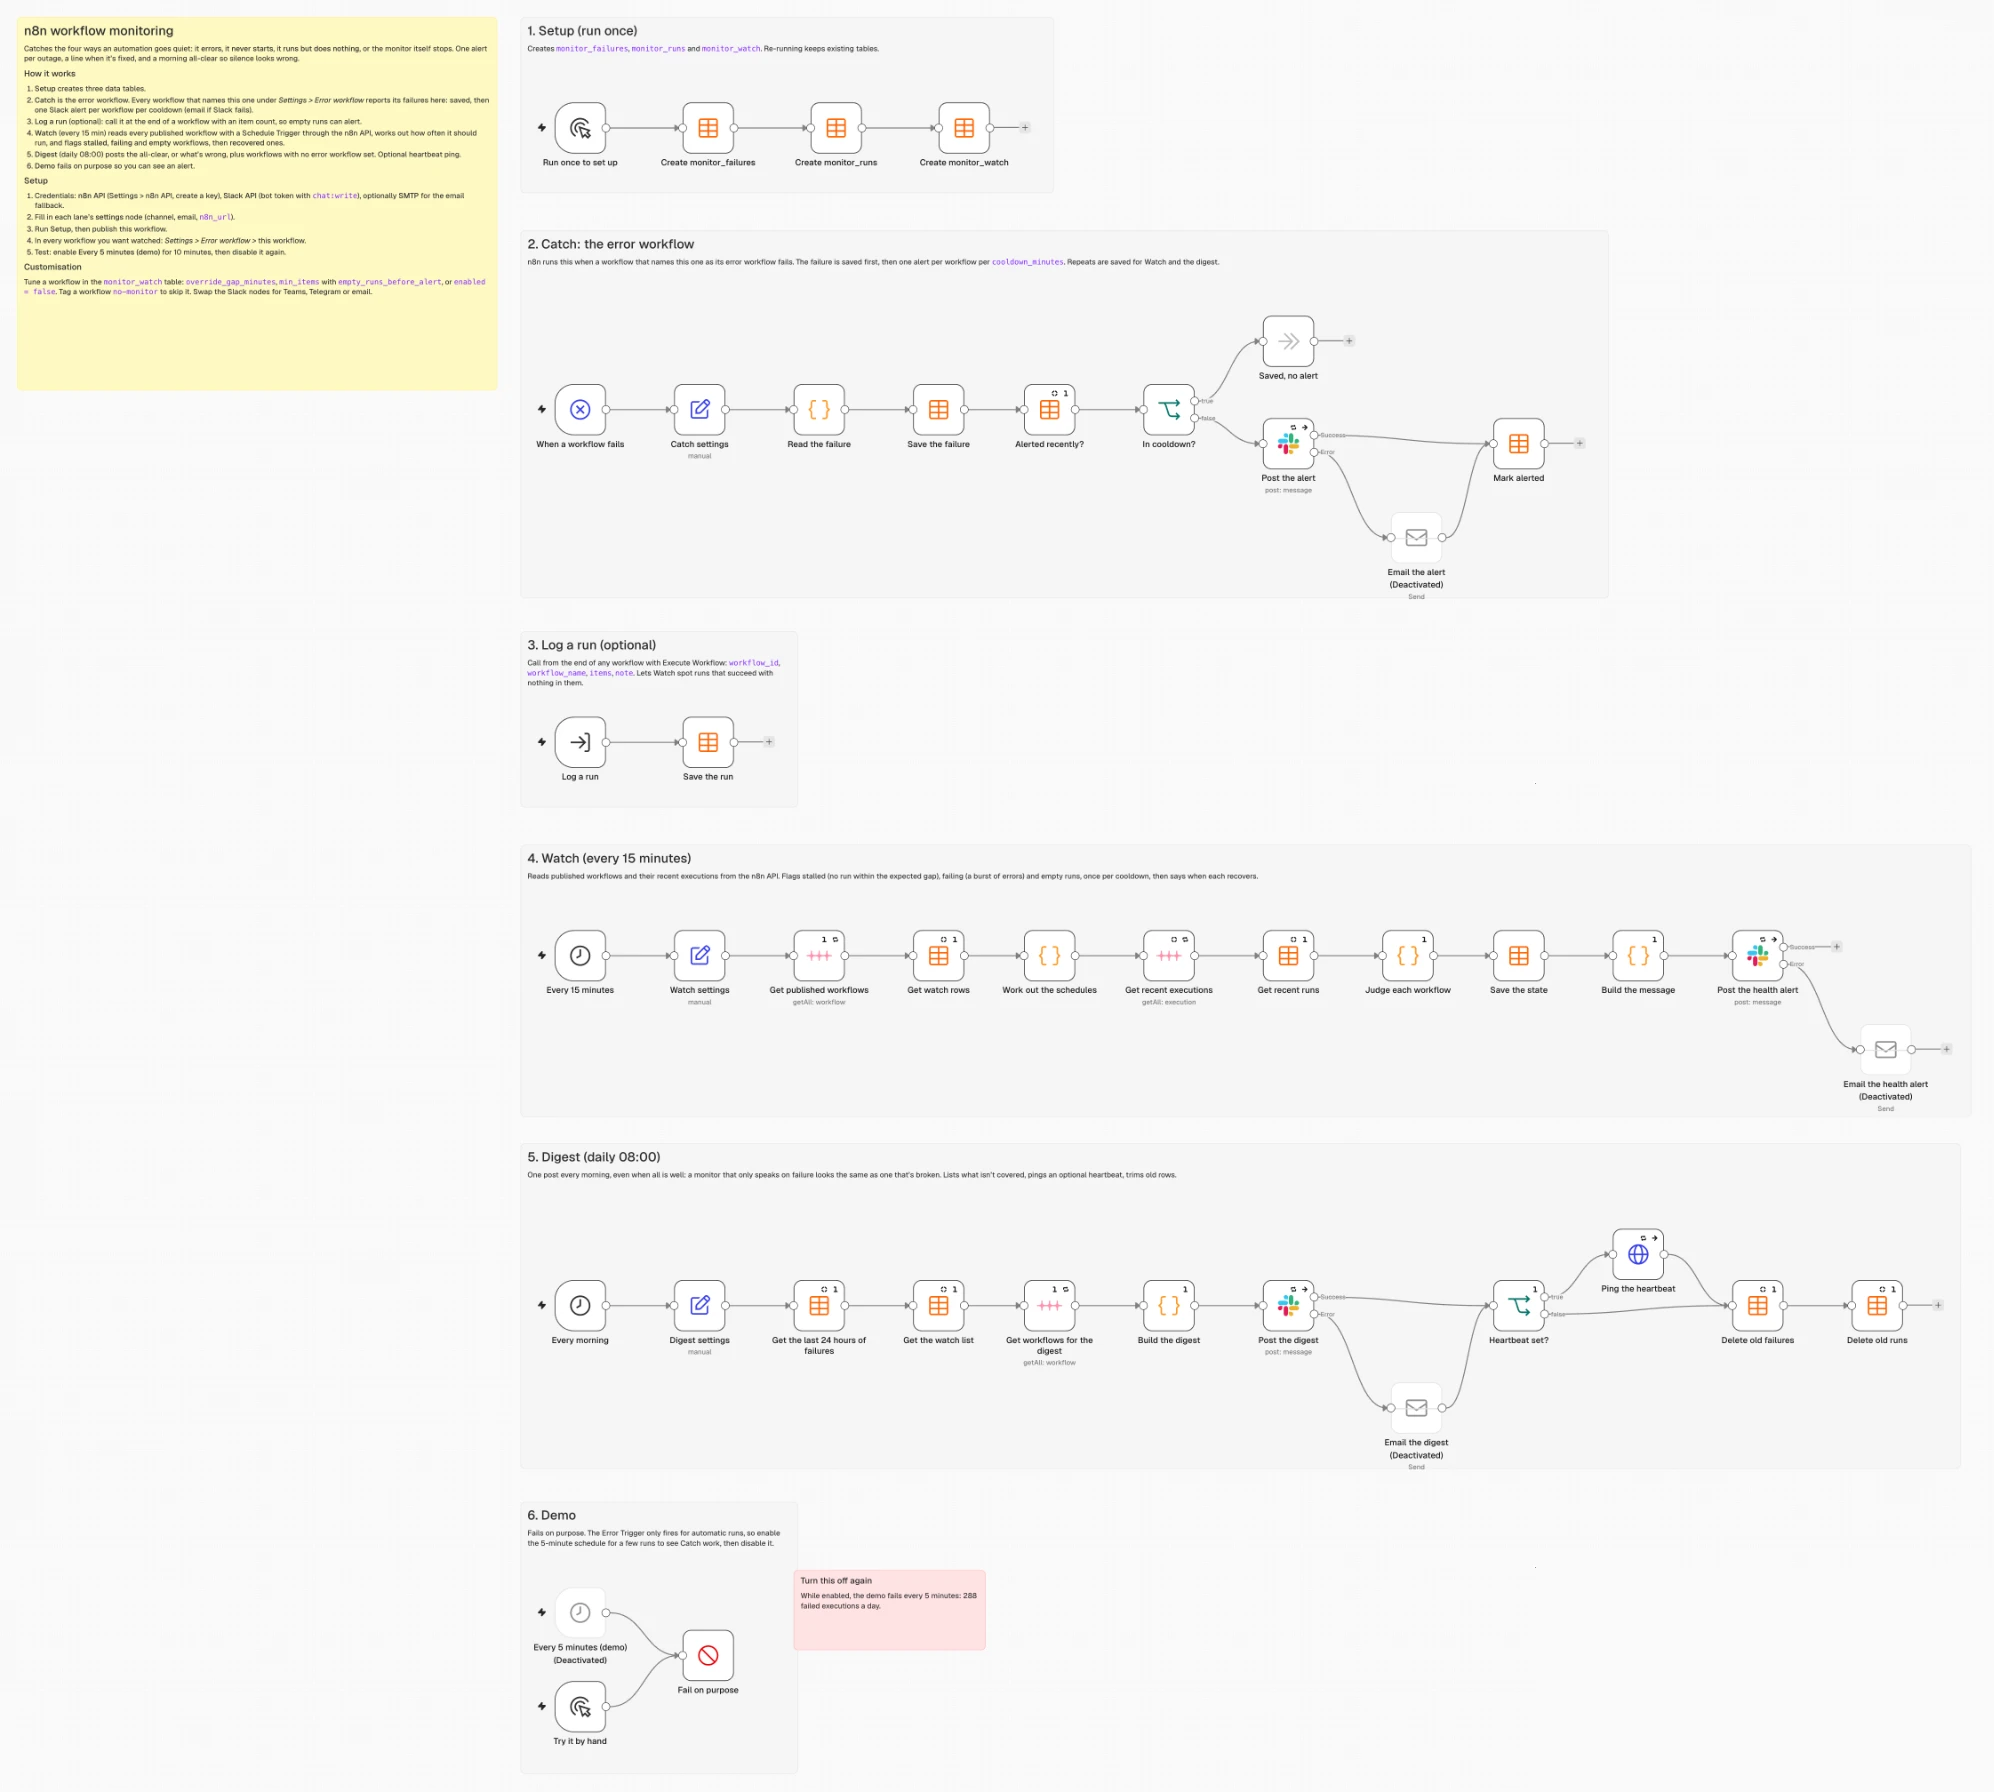
All six lanes live on a single workflow canvas backed by three n8n Data Tables:
Error handling inside a workflow, and why it isn’t enough
By default, a failed node stops the workflow immediately and records a red execution in your history without notifying anyone. Good n8n error handling best practices start inside the workflow itself, using three node-level tools before an external monitor ever gets involved.
Turning on Retry On Fail in a node’s Settings tab (up to 5 tries, spaced up to 5,000 ms apart) absorbs transient rate limits and brief network blips before they become real incidents. On an n8n instance I run for a store, in the 30 days to 8 November 2026, 33 workflows failed 1,930 times between them, and 1,081 of those (56%) were a single workflow hitting an image host’s rate limit. Retries stop temporary blips from waking anyone up, and alerting once per outage rather than once per failure is what keeps an alert channel readable instead of muted.
For non-critical steps that are allowed to fail, set On Error to Continue (using error output) and wire that second output to a fallback path. Be careful here, because enabling the error output without wiring anything to it swallows the failure and marks the execution green. When the opposite happens and an HTTP request returns 200 OK with an empty payload or a missing required field, drop in a Stop And Error node to force the execution to fail so your error workflow catches it.
None of these internal tools can catch a workflow that never starts because someone deactivated it, a trigger failed to register, or the server was down at 3am. They also miss runs that finish green with zero items and can’t stop an alert storm when an upstream API goes down for an hour.
n8n’s built-in Insights feature gives you a 7-day summary banner on every plan and a full failure-rate dashboard on Cloud Pro, Cloud Enterprise, and self-hosted Business and Enterprise, though it remains a page you have to remember to check rather than an active alert. On n8n’s template library, template 13290 inspects schedule triggers via the n8n API and raises an error when a workflow is overdue, while template 20896 emails a daily liveness report and notes plainly that the watchdog can’t report its own absence. Either template is worth using if you only need a schedule check, whereas building stateful tables adds cooldowns, recovery notices, real-time crash alerts and a heartbeat check on one canvas.
What you need
- n8n with Data Tables, either self-hosted (free Community Edition) or on a paid n8n Cloud plan, because the n8n public API isn’t available during the Cloud free trial.
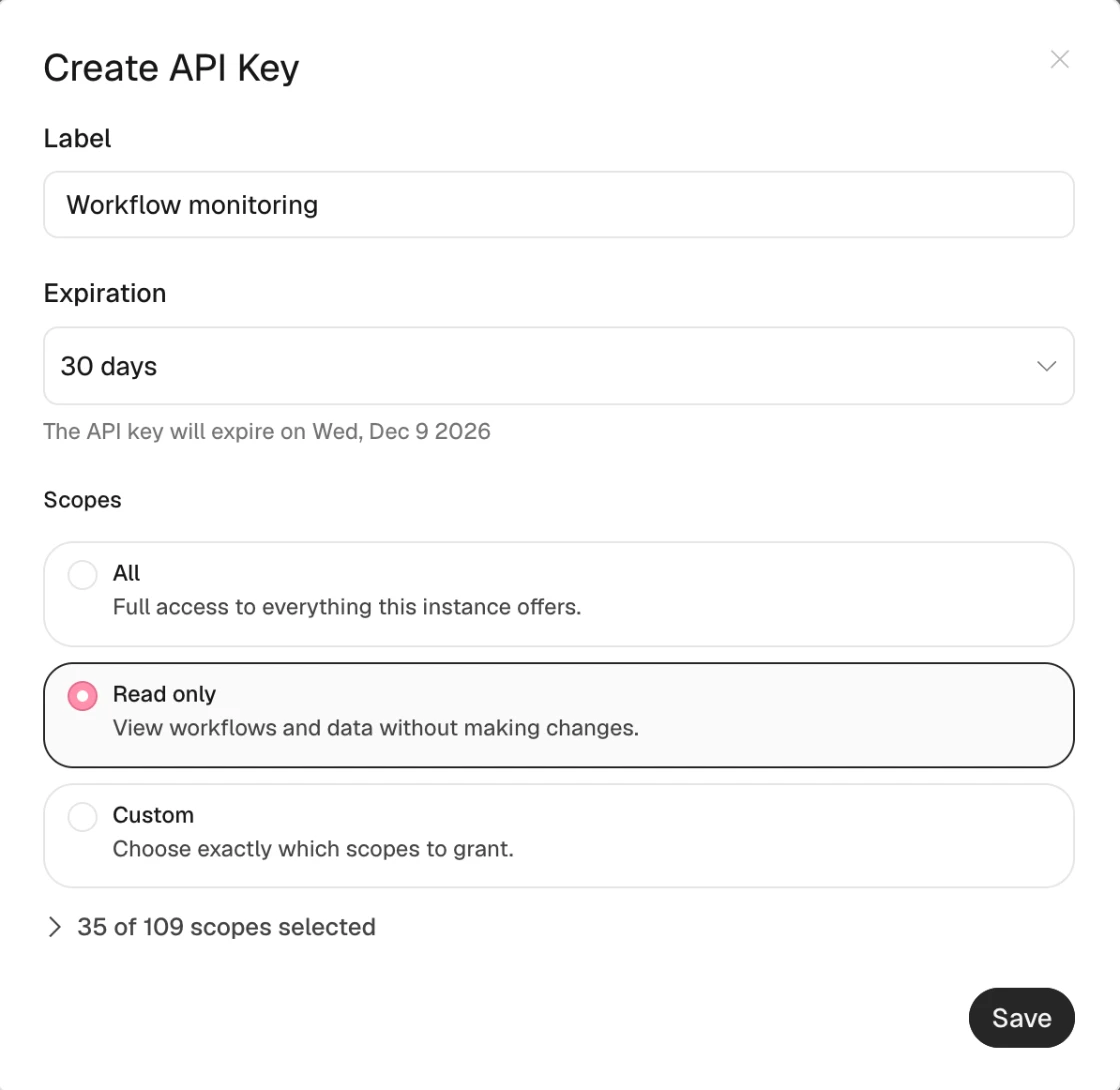
- An n8n API key, created under Settings > n8n API > Create an API key. If the dialog offers scopes, pick the Read only preset: it includes
workflow:list,workflow:read,execution:listandexecution:read, which is all the monitor uses. Without scopes the key has full access, which works too, because the template only reads. Either way, you should pick an expiration longer than the 30-day default so your monitor doesn’t lock itself out next month. - A Slack app with the
chat:writebot scope (pluschat:write.publicto post in public channels the bot hasn’t been invited to) and its bot token, or swap the Slack nodes for email, Telegram or Microsoft Teams. - Optional: an SMTP credential for the email fallback nodes, and a free Healthchecks.io account (20 checks on the $0 Hobbyist plan) for the external heartbeat URL. If you prefer Postgres over Data Tables, the GitHub repo also includes a Supabase version of this template.
How it works
Reliable workflow monitoring needs to catch crashes as they happen, poll for missing or empty runs on a timer, and prove that the monitor itself is still alive:
- Setup runs once by hand to create three n8n Data Tables (
monitor_failures,monitor_runsandmonitor_watch) that give the monitor memory across runs. - Catch acts as your instance’s error workflow, saving every failure row first before sending one Slack alert per workflow per cooldown window.
- Log a run is an optional sub-workflow trigger that any workflow can call at the end of a run to record how many items it processed, allowing the monitor to spot runs that finish green with nothing in them.
- Watch runs every 15 minutes, inspects every published workflow’s Schedule Trigger and recent executions through the n8n API, and alerts once when a workflow is stalled, failing in a burst or logging empty runs, then posts again when it recovers.
- Digest runs every morning at 08:00 to post either a summary of problems or an explicit all-clear, lists published workflows that aren’t covered yet, pings an external heartbeat URL, and prunes rows older than 30 days.
- Demo fails on purpose on a 5-minute schedule so you can test the entire alert and cooldown loop without breaking a production workflow, while watched workflows only need Settings > Error workflow pointed at this canvas.
Step 1: Create the monitoring tables
Alerts need state so the workflow knows whether it already paged you ten minutes ago, whether a broken schedule has recovered, and how many times an API failed overnight. In the Setup lane, add a Manual Trigger named Run once to set up and wire it to three Data table nodes in sequence: Create monitor_failures, Create monitor_runs and Create monitor_watch.
All three nodes use Resource: table, Operation: create, and turn Options > Reuse existing table on so re-running Setup never wipes your existing history. Set the table name and columns on Create monitor_failures to store one row per failed execution:
| Setting | Value |
|---|---|
| Resource | table |
| Operation | create |
| Table name | monitor_failures |
| Options > Reuse existing table | on |
| Column: workflow_id | string |
| Column: workflow_name | string |
| Column: execution_id | string |
| Column: execution_url | string |
| Column: node_name | string |
| Column: error_message | string |
| Column: mode | string |
| Column: failed_at | date |
| Column: alerted | boolean |
Configure Create monitor_runs with Table name monitor_runs to hold item counts from workflows that opt into empty-run logging:
| Setting | Value |
|---|---|
| Column: workflow_id | string |
| Column: workflow_name | string |
| Column: items | number |
| Column: note | string |
| Column: ran_at | date |
Configure Create monitor_watch with Table name monitor_watch to hold each watched workflow’s inferred schedule, your manual overrides and its current alert state:
| Setting | Value |
|---|---|
| Column: workflow_id | string |
| Column: workflow_name | string |
| Column: schedule | string |
| Column: max_gap_minutes | number |
| Column: override_gap_minutes | number |
| Column: min_items | number |
| Column: empty_runs_before_alert | number |
| Column: enabled | boolean |
| Column: alerting | boolean |
| Column: alert_kind | string |
| Column: last_alert_at | date |
Check: Click Execute workflow on Run once to set up and confirm that monitor_failures, monitor_runs and monitor_watch appear under Data tables in the left sidebar.
Step 2: Build the n8n error workflow
When an automatic execution fails, n8n passes the crash details to whichever workflow is selected as that workflow’s error handler. Start the Catch lane with an Error Trigger node named When a workflow fails (the n8n Error Trigger takes no parameters and fires only on automatic runs). Connect an Edit Fields (Set) node named Catch settings with Include other input fields turned on so your channel, email and 120-minute cooldown travel alongside the error payload:
| Setting | Value |
|---|---|
| Include other input fields | on |
| slack_channel (string) | #n8n-alerts |
| alert_email (string) | [email protected] |
| from_email (string) | [email protected] |
| cooldown_minutes (number) | 120 |
| timezone (string) | UTC |
Next, add a Code node named Read the failure. An error workflow receives two different payload shapes: a normal crash populates execution{} with an ID, URL and last node executed, whereas a trigger that failed to start populates trigger{} with no execution ID at all. Normalising both shapes and trimming whitespace in a single Code node saves wiring four or five Set and If nodes:
// Two payload shapes: a failed execution (execution.*) and a trigger that couldn't start (trigger.*, no execution id).
const j = $input.first().json;
const ex = j.execution || {};
const tr = j.trigger || {};
const wf = j.workflow || {};
const err = ex.error || tr.error || {};
let message = String(err.message || 'Unknown error').trim();
if (err.description && !message.includes(err.description)) message += ' ' + String(err.description).trim();
return [{ json: {
  workflow_id: String(wf.id || ''),
  workflow_name: wf.name || 'Unknown workflow',
  execution_id: ex.id ? String(ex.id) : '',
  execution_url: ex.url || '',
  node_name: ex.lastNodeExecuted || (err.node && err.node.name) || (tr.error && tr.error.node && tr.error.node.name) || '',
  error_message: message.replace(/\s+/g, ' ').slice(0, 2000),
  mode: ex.id ? (ex.mode || 'trigger') : 'activation',
  failed_at: $now.toISO(),
} }];
Connect a Data table node named Save the failure right after Read the failure. Saving the row before attempting any network call ensures that even if Slack and your mail server are both down, the failure is still recorded for Watch and the morning digest:
| Setting | Value |
|---|---|
| Resource | row |
| Operation | insert |
| Data table | monitor_failures |
| Column: workflow_id | {{ $json.workflow_id }} |
| Column: workflow_name | {{ $json.workflow_name }} |
| Column: execution_id | {{ $json.execution_id }} |
| Column: execution_url | {{ $json.execution_url }} |
| Column: node_name | {{ $json.node_name }} |
| Column: error_message | {{ $json.error_message }} |
| Column: mode | {{ $json.mode }} |
| Column: failed_at | {{ $json.failed_at }} |
| Column: alerted | {{ false }} |
To check whether this workflow has already alerted during the current outage, connect a Data table node named Alerted recently? (turn on Execute Once and Always Output Data in the node settings so a zero-row result still continues down the canvas):
| Setting | Value |
|---|---|
| Resource | row |
| Operation | get |
| Data table | monitor_failures |
| Must match | All conditions |
| Condition: workflow_id | eq {{ $('Read the failure').first().json.workflow_id }} |
| Condition: alerted | eq {{ true }} |
| Condition: failed_at | gt {{ $now.minus({ minutes: $('Catch settings').first().json.cooldown_minutes }).toISO() }} |
| Return all | on |
Wire Alerted recently? to an If node named In cooldown? that checks whether any matching row came back:
| Setting | Value |
|---|---|
| Value 1 | {{ $input.all().some(i => i.json.id) }} |
| Operator | boolean true |
| Value 2 | “ |
Connect the true output (output 0) to a No Operation node named Saved, no alert. Connect the false output (output 1) to a Slack node named Post the alert. In the Slack node’s Settings tab, enable Retry On Fail (3 tries, 5000 ms apart) and set On Error to Continue (using error output) so a Slack outage routes to the email fallback instead of crashing the monitor:
| Setting | Value |
|---|---|
| Resource | Message |
| Operation | Send |
| Send Message To | Channel |
| Channel | {{ $('Catch settings').first().json.slack_channel }} (By ID) |
| Message Type | Blocks |
| Notification Text | {{ String('🔴 ' + $('Read the failure').first().json.workflow_name + ' failed').slice(0, 150) }} |
| Options > Include Link to Workflow | off |
| Options > Unfurl Links / Unfurl Media | off |
| Credential | Slack API (bot token) |
Set the Blocks parameter to an expression that builds a Slack Block Kit header, a section with the stopping node, the error message trimmed to 600 characters and escaped for Slack markdown, the execution link, and a timestamped context footer:
{{ ({ blocks: [{ type: 'header', text: { type: 'plain_text', emoji: true, text: String('🔴 ' + $('Read the failure').first().json.workflow_name + ' failed').slice(0, 150) } }, { type: 'section', text: { type: 'mrkdwn', text: String((f => (f.node_name ? 'Stopped at *' + f.node_name + '*\n' : '') + '```' + f.error_message.slice(0, 600).replace(/```/g, "'''").replace(/&/g, '&').replace(/</g, '<').replace(/>/g, '>') + '```' + (f.mode === 'activation' ? '\nThe trigger failed, so the workflow never started.' : '') + (f.execution_url ? '\n<' + f.execution_url + '|Open the execution>' : ''))($('Read the failure').first().json)).slice(0, 2900) } }, { type: 'context', elements: [{ type: 'mrkdwn', text: 'n8n workflow monitor · ' + $now.setZone($('Catch settings').first().json.timezone).toFormat('d LLL, h:mm a') }] }] }) }}Connect the error output (output 1) of Post the alert to a Send Email node named Email the alert, with Retry On Fail set to 2 tries, 5000 ms apart. Leave Email the alert disabled until you add an SMTP credential, because n8n won’t let you publish a workflow while an enabled node has no credential configured:
| Setting | Value |
|---|---|
| From Email | {{ $('Catch settings').first().json.from_email }} |
| To Email | {{ $('Catch settings').first().json.alert_email }} |
| Subject | {{ String('🔴 ' + $('Read the failure').first().json.workflow_name + ' failed').slice(0, 150) }} |
| Email Format | Text |
| Credential | SMTP |
Use this expression for the email Text field to strip Slack formatting and turn the link into plain text:
{{ String((f => (f.node_name ? 'Stopped at *' + f.node_name + '*\n' : '') + '```' + f.error_message.slice(0, 600).replace(/```/g, "'''").replace(/&/g, '&').replace(/</g, '<').replace(/>/g, '>') + '```' + (f.mode === 'activation' ? '\nThe trigger failed, so the workflow never started.' : '') + (f.execution_url ? '\n<' + f.execution_url + '|Open the execution>' : ''))($('Read the failure').first().json)).replace(/<([^|>]+)\|([^>]+)>/g, '$2: $1').replace(/[*_]/g, '') }}Wire both the main output (output 0) of Post the alert and the output of Email the alert into a Data table node named Mark alerted. Because a disabled node passes its input item straight through, a failed Slack post with Email the alert still disabled passes $json.error into Mark alerted, so {{ !$json.error }} records alerted = false and allows the next failure to try alerting again:
| Setting | Value |
|---|---|
| Resource | row |
| Operation | update |
| Data table | monitor_failures |
| Must match | All conditions |
| Condition: id | eq {{ $('Save the failure').first().json.id }} |
| Column: alerted | {{ !$json.error }} |
To test the Catch lane without breaking a production workflow, build the Demo lane at the bottom of the canvas with a disabled Schedule Trigger named Every 5 minutes (demo) (Trigger interval: Minutes, Minutes between triggers: 5) and a Manual Trigger named Try it by hand, both wired to a Stop and Error node named Fail on purpose (Error Type: Error Message, Error Message: Demo failure: the supplier feed returned 0 rows). Add a red sticky note next to the demo reminding you to turn it off again after testing, since leaving a 5-minute demo trigger enabled creates 288 failed executions a day.
In every workflow you want to monitor, open Workflow Settings (the three dots menu > Settings) and set Error workflow to this monitoring workflow:
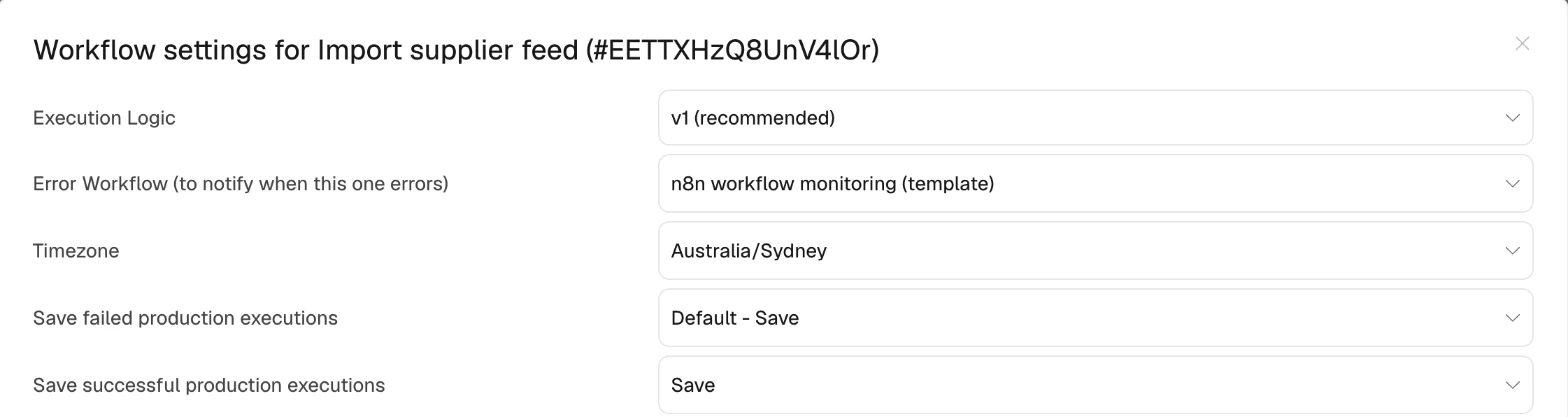
As n8n’s Error Trigger documentation notes, a workflow that contains an Error Trigger node uses itself as its error workflow by default, which means the Watch, Digest and Demo lanes on this canvas are automatically covered by Catch. If Catch itself crashes (for example, Slack fails and you enabled Email the alert with a broken SMTP server), n8n does not fire the Error Trigger a second time, preventing an infinite loop while leaving the failure safely recorded in monitor_failures and the Catch execution marked red.
Check: Click Execute workflow on Try it by hand and confirm that Fail on purpose turns red without triggering Catch, because manual runs never fire the Error Trigger. Next, enable Every 5 minutes (demo) and publish the workflow: the first automatic run posts a Slack alert and marks alerted = true in monitor_failures, while the second run 5 minutes later adds a second row with alerted = false and sends no message. Disable Every 5 minutes (demo) and publish the workflow again.
Step 3: Log runs that finish with nothing in them
An HTTP Request or FTP node that fetches a supplier file with zero rows finishes green, so n8n records a successful execution even when your catalogue hasn’t updated all week. Adding lightweight n8n logging for workflows where item count matters lets Watch catch consecutive empty runs.
In the Log lane, add an Execute Workflow Trigger node named Log a run. Keep this as the only Execute Workflow Trigger on the canvas, because n8n always starts a called sub-workflow at its first Execute Workflow Trigger:
| Setting | Value |
|---|---|
| Input data mode | Define using fields below |
| Input: workflow_id | string |
| Input: workflow_name | string |
| Input: items | number |
| Input: note | string |
Connect Log a run to a Data table node named Save the run:
| Setting | Value |
|---|---|
| Resource | row |
| Operation | insert |
| Data table | monitor_runs |
| Column: workflow_id | {{ String($json.workflow_id || "") }} |
| Column: workflow_name | {{ $json.workflow_name }} |
| Column: items | {{ Number($json.items) || 0 }} |
| Column: note | {{ $json.note || "" }} |
| Column: ran_at | {{ $now.toISO() }} |
Make sure your monitoring workflow is published first, because n8n won’t let you publish a caller workflow that references an unpublished sub-workflow. At the end of a watched workflow such as Sync inventory, add an Execute Workflow node with Wait for sub-workflow completion turned off so logging never slows down or fails the main run, and note that sub-workflow executions don’t count towards your plan’s monthly execution limit:
| Setting | Value |
|---|---|
| Source | Database |
| Workflow | This monitoring workflow (By ID) |
| Mode | Run once with all items |
| Wait for sub-workflow completion | Off |
workflow_id | {{ $workflow.id }} |
workflow_name | {{ $workflow.name }} |
items | {{ $('Do the work').all().filter(i => i.json.sku).length }} |
note | (blank) |
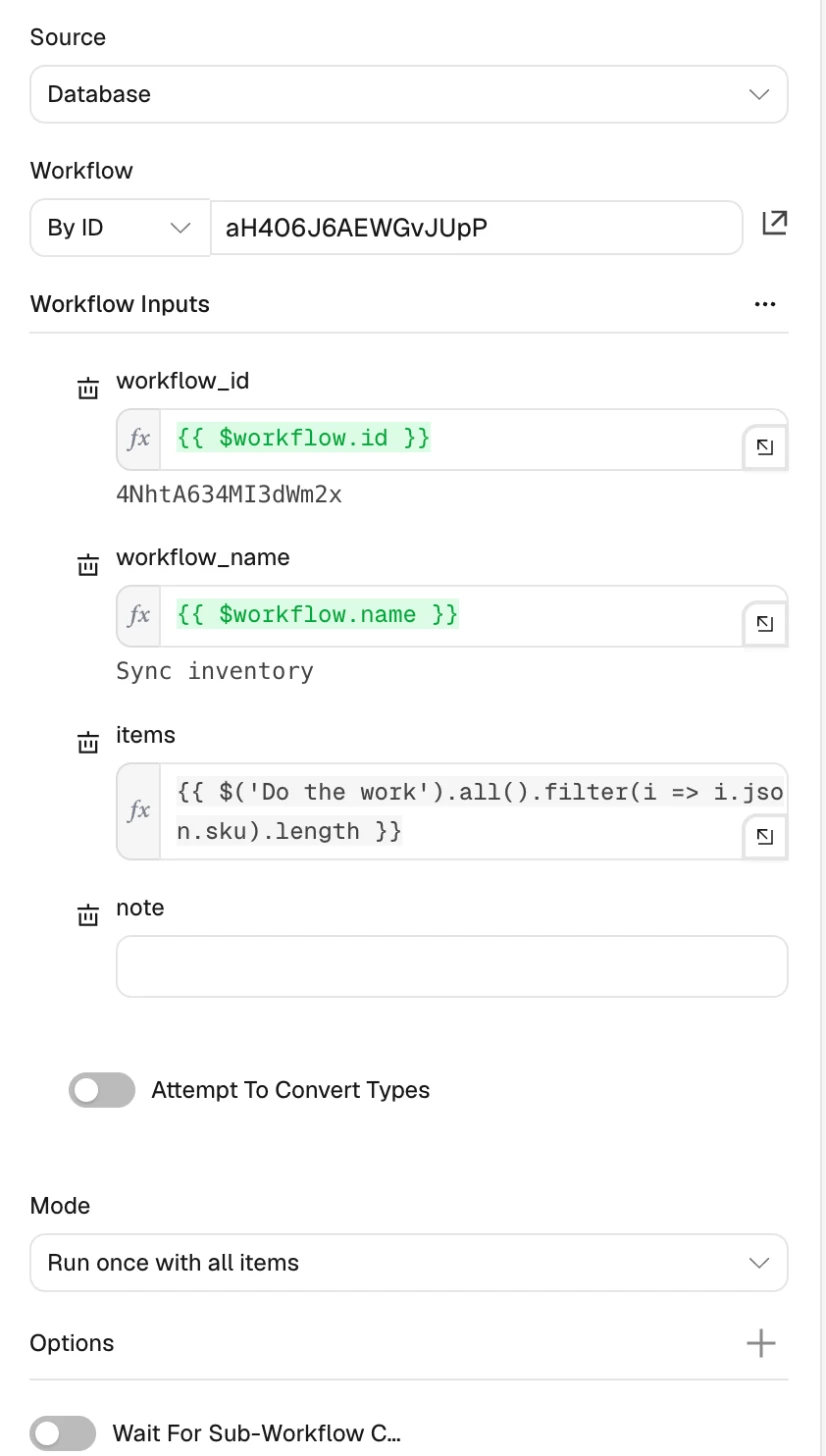
Once Step 4 populates monitor_watch, set min_items to 1 (and optionally empty_runs_before_alert, which defaults to 3) on the Sync inventory row in monitor_watch.
Check: Run Sync inventory once and verify that a new row appears in monitor_runs with its workflow_id, workflow_name and items count.
Step 4: Find every scheduled workflow and work out when it should run
External cron job monitoring tools require you to create a separate ping URL and add an HTTP node to the end of every scheduled job, which is tedious when you already have 40 workflows. Reading your workflows and their Schedule Triggers directly through the n8n node means watched workflows need no extra nodes at all.
Start the Watch lane with a Schedule Trigger named Every 15 minutes (Trigger interval: Minutes, Minutes between triggers: 15), wired to an Edit Fields (Set) node named Watch settings (with Include other input fields off):
| Setting | Value |
|---|---|
| slack_channel (string) | #n8n-alerts |
| alert_email (string) | [email protected] |
| from_email (string) | [email protected] |
| n8n_url (string) | https://your-n8n.example.com |
| only_tag (string) | “ |
| ignore_tag (string) | no-monitor |
| grace_ratio (number) | 0.5 |
| grace_min_minutes (number) | 30 |
| failing_threshold (number) | 5 |
| cooldown_minutes (number) | 120 |
| timezone (string) | UTC |
Connect an n8n node named Get published workflows (with Execute Once on, and Retry On Fail set to 3 tries, 5000 ms apart) to fetch all active workflows, optionally filtered by only_tag:
| Setting | Value |
|---|---|
| Resource | Workflow |
| Operation | Get Many |
| Return All | on |
| Filters > Return Only Active Workflows | on |
| Filters > Tags | {{ $json.only_tag }} |
| Filters > Exclude Pinned Data | on |
| Credential | n8n API |
Connect a Data table node named Get watch rows (Resource: row, Operation: get, Data table: monitor_watch, Return all: on, with Execute Once and Always Output Data enabled) so your existing alert state and manual overrides are available in memory. Next, add a Code node named Work out the schedules.
Because no built-in node parses n8n schedule rules or cron expressions, Work out the schedules inspects every enabled scheduleTrigger node on each workflow. For standard intervals (seconds, minutes, hours, days, weeks, months) it calculates the gap directly, and for cron expressions it simulates 62 days from a Monday to find the longest gap between any two consecutive runs (handling month and day names, ranges, steps, optional 6-field seconds, and cron’s rule when both day-of-month and day-of-week are restricted). It takes the shortest gap across a workflow’s triggers and adds a grace margin equal to the larger of grace_min_minutes (30) or gap * grace_ratio (0.5). That margin is why Publish new products (cron 0 9 * * 1-5, whose longest gap is Friday 09:00 to Monday 09:00, or 4,320 minutes) gets a limit of 6,480 minutes (4.5 days) and never false-alerts over the weekend, while an hourly workflow gets 90 minutes and a 2-hour workflow gets 180 minutes. The code skips this monitoring workflow itself, any workflow tagged no-monitor, rows with enabled = false, and webhook-only workflows that have no schedule trigger and no override_gap_minutes:
// Works out how often each published workflow should run, from its Schedule Trigger.
// Why Code: no node parses a schedule rule or a cron expression.
const s = $('Watch settings').first().json;
const self = $workflow.id;
const rows = {};
for (const { json: r } of $('Get watch rows').all()) if (r && r.workflow_id) rows[String(r.workflow_id)] = r;

const DAY = 1440;
const fmt = m => m >= DAY ? (m % DAY ? Math.round(m / 60) + ' h' : (m / DAY) + (m === DAY ? ' day' : ' days')) : m >= 60 ? (m % 60 ? Math.floor(m / 60) + ' h ' + (m % 60) + ' min' : (m / 60) + ' h') : m + ' min';

function expand(field, lo, hi, names = []) {
  const set = new Set();
  for (let part of String(field).toUpperCase().split(',')) {
    names.forEach((n, i) => { part = part.replace(new RegExp('\\b' + n + '\\b', 'g'), String(i + lo)); });
    let [range, step] = part.split('/');
    step = step ? Number(step) : 1;
    let a = lo, b = hi;
    if (range !== '*' && range !== '?') {
      const m = range.match(/^(\d+)(?:-(\d+))?$/);
      if (!m) return null;
      a = Number(m[1]); b = m[2] !== undefined ? Number(m[2]) : (step > 1 ? hi : a);
    }
    for (let v = a; v <= b; v += step) set.add(v);
  }
  return set;
}

function cronGap(expr) {
  let f = String(expr || '').trim().split(/\s+/);
  if (f.length === 6) f = f.slice(1);              // n8n allows a seconds field first
  if (f.length !== 5) return null;
  const min = expand(f[0], 0, 59), hour = expand(f[1], 0, 23), dom = expand(f[2], 1, 31);
  const mon = expand(f[3], 1, 12, ['JAN','FEB','MAR','APR','MAY','JUN','JUL','AUG','SEP','OCT','NOV','DEC']);
  const dow = expand(f[4].replace(/\b7\b/g, '0'), 0, 6, ['SUN','MON','TUE','WED','THU','FRI','SAT']);
  if (!min || !hour || !dom || !mon || !dow) return null;
  const domAny = f[2] === '*' || f[2] === '?', dowAny = f[4] === '*' || f[4] === '?';
  const times = [];
  const start = Date.UTC(2026, 0, 5);                // any Monday; 62 days covers monthly schedules
  for (let d = 0; d < 62; d++) {
    const day = new Date(start + d * 864e5);
    if (!mon.has(day.getUTCMonth() + 1)) continue;
    const okDom = dom.has(day.getUTCDate()), okDow = dow.has(day.getUTCDay());
    if (!(domAny && dowAny ? true : domAny ? okDow : dowAny ? okDom : (okDom || okDow))) continue;
    for (const h of [...hour].sort((a, b) => a - b)) for (const m of [...min].sort((a, b) => a - b)) times.push(d * DAY + h * 60 + m);
  }
  if (times.length < 2) return null;
  let gap = 0;
  for (let i = 1; i < times.length; i++) gap = Math.max(gap, times[i] - times[i - 1]);
  return gap;
}

function ruleGap(iv) {
  const field = iv.field || 'days';
  if (field === 'cronExpression') return { gap: cronGap(iv.expression), text: 'cron ' + iv.expression };
  if (field === 'seconds') return { gap: 1, text: 'every ' + (iv.secondsInterval || 30) + ' s' };
  if (field === 'minutes') { const n = iv.minutesInterval || 5; return { gap: n, text: 'every ' + fmt(n) }; }
  if (field === 'hours') { const n = (iv.hoursInterval || 1) * 60; return { gap: n, text: 'every ' + fmt(n) }; }
  if (field === 'days') { const n = (iv.daysInterval || 1); return { gap: n * DAY, text: n === 1 ? 'daily' : 'every ' + n + ' days' }; }
  if (field === 'weeks') {
    const n = iv.weeksInterval || 1;
    const days = [...new Set((iv.triggerAtDay && iv.triggerAtDay.length ? iv.triggerAtDay : [0]).map(Number))].sort((a, b) => a - b);
    if (n > 1 || days.length === 1) return { gap: n * 7 * DAY, text: n > 1 ? 'every ' + n + ' weeks' : 'weekly' };
    let gap = 0;
    for (let i = 0; i < days.length; i++) gap = Math.max(gap, ((days[(i + 1) % days.length] - days[i] + 7) % 7 || 7) * DAY);
    return { gap, text: days.length === 5 && days.join() === '1,2,3,4,5' ? 'weekdays' : days.length + ' days a week' };
  }
  if (field === 'months') { const n = iv.monthsInterval || 1; return { gap: n * 31 * DAY, text: n === 1 ? 'monthly' : 'every ' + n + ' months' }; }
  return { gap: null, text: field };
}

const out = [];
for (const { json: w } of $('Get published workflows').all()) {
  if (!w || !w.id || w.id === self) continue;
  const tags = (w.tags || []).map(t => t.name);
  if (s.ignore_tag && tags.includes(s.ignore_tag)) continue;
  const row = rows[String(w.id)] || {};
  if (row.enabled === false) continue;
  const override = Number(row.override_gap_minutes) > 0 ? Number(row.override_gap_minutes) : null;
  const triggers = (w.nodes || []).filter(n => n.type === 'n8n-nodes-base.scheduleTrigger' && !n.disabled);
  if (!triggers.length && !override) continue;      // webhook-only: Catch still sees its failures
  let gap = null; const texts = [];
  for (const t of triggers) for (const iv of ((t.parameters.rule || {}).interval || [{}])) {
    const r = ruleGap(iv); texts.push(r.text);
    if (r.gap) gap = gap === null ? r.gap : Math.min(gap, r.gap);
  }
  const inferred = gap ? Math.round(gap + Math.max(s.grace_min_minutes, gap * s.grace_ratio)) : null;
  out.push({ json: {
    workflow_id: String(w.id), workflow_name: w.name, schedule: texts.join(', ') || 'manual gap',
    expected_minutes: override || gap, max_gap_minutes: inferred, limit_minutes: override || inferred,
    saves_success: !(w.settings && w.settings.saveDataSuccessExecution === 'none'),
    updated_at: w.updatedAt, row,
  } });
}
return out;
Check: Once you connect the rest of the Watch lane in Step 5 and run it once, open monitor_watch to see Sync inventory (every 1 h, max_gap_minutes: 90), Import supplier feed (every 2 h, max_gap_minutes: 180) and Publish new products (cron 0 9 * * 1-5, max_gap_minutes: 6480):

Step 5: Check for stalls, bursts and empty runs every 15 minutes
Reading execution history from the n8n API rather than relying solely on self-logged rows is what lets Watch detect a workflow that never started at all. Connect Work out the schedules to an n8n node named Get recent executions (turn on Always Output Data so a brand-new workflow with zero executions doesn’t halt the lane, and set Retry On Fail to 3 tries, 5000 ms apart):
| Setting | Value |
|---|---|
| Resource | Execution |
| Operation | Get Many |
| Limit | 50 |
| Filters > Workflow | {{ $json.workflow_id }} (By ID) |
| Credential | n8n API |
Connect a Data table node named Get recent runs (with Execute Once and Always Output Data on) to pull the last 7 days of item-count logs from monitor_runs:
| Setting | Value |
|---|---|
| Resource | row |
| Operation | get |
| Data table | monitor_runs |
| Must match | All conditions |
| Condition: ran_at | gt {{ $now.minus({ days: 7 }).toISO() }} |
| Return all | on |
Next, add a Code node named Judge each workflow (with Execute Once on). For each scheduled workflow, it evaluates four conditions:
- stalled: no non-manual execution has started within
limit_minutes(if a workflow has never run, it measures fromupdated_atwhen the workflow was last saved, and skips the stall check if the workflow doesn’t save successful executions). - failing: at least
failing_threshold(5)errororcrashedexecutions occurred in the last hour, surfacing a burst that Catch kept quiet during its cooldown. - empty: the last
empty_runs_before_alert(default 3) rows inmonitor_runsall had fewer items thanmin_items. - recovered: the workflow had
alerting = trueon the previous check and now has no active issue, so your team knows at 09:00 whether the 03:00 alert is already resolved.
It respects cooldown_minutes before repeating an ongoing alert and outputs only workflows whose schedule metadata or alert state changed:
// Judges each workflow: stalled, failing, empty, or recovered. Outputs only rows whose state changed.
const s = $('Watch settings').first().json;
const now = Date.now();
const plan = $('Work out the schedules').all().map(i => i.json);
const execs = $('Get recent executions').all().map(i => i.json).filter(e => e && e.id && e.mode !== 'manual');
const runs = $('Get recent runs').all().map(i => i.json).filter(r => r && r.workflow_id);
const fmt = m => m >= 2880 ? Math.round(m / 1440) + ' days' : m >= 120 ? Math.round(m / 60) + ' h' : m >= 60 ? '1 h ' + (m - 60) + ' min' : m + ' min';
const link = id => s.n8n_url ? ' <' + s.n8n_url.replace(/\/$/, '') + '/workflow/' + id + '/executions|Executions>' : '';

const out = [];
for (const p of plan) {
  const row = p.row || {};
  const mine = execs.filter(e => String(e.workflowId) === p.workflow_id);
  const last = Math.max(0, ...mine.map(e => Date.parse(e.startedAt) || 0));
  const since = last || Date.parse(p.updated_at) || now;            // never ran: count from when it was last saved
  const idle = Math.floor((now - since) / 60000);
  const fails = mine.filter(e => ['error', 'crashed'].includes(e.status) && Date.parse(e.startedAt) > now - 3600e3).length;
  const minItems = Number(row.min_items) > 0 ? Number(row.min_items) : null;
  const k = Number(row.empty_runs_before_alert) > 0 ? Number(row.empty_runs_before_alert) : 3;
  const recent = runs.filter(r => String(r.workflow_id) === p.workflow_id || (!r.workflow_id && r.workflow_name === p.workflow_name))
                     .sort((a, b) => Date.parse(b.ran_at) - Date.parse(a.ran_at)).slice(0, k);

  let issue = '', line = '';
  if (p.saves_success && p.limit_minutes && idle > p.limit_minutes) {
    issue = 'stalled';
    line = last ? `no run for ${fmt(idle)} (expected every ${fmt(p.expected_minutes)})` : `no run in the ${fmt(idle)} since it was last saved`;
  } else if (fails >= s.failing_threshold) {
    issue = 'failing'; line = `${fails} failed runs in the last hour`;
  } else if (minItems && recent.length >= k && recent.every(r => Number(r.items) < minItems)) {
    issue = 'empty'; line = (k === 1 ? 'the last run had ' : `the last ${k} runs all had `) + (minItems === 1 ? 'no items' : `fewer than ${minItems} items (latest: ${Number(recent[0].items)})`);
  }

  const was = row.alerting === true;
  const cooled = !row.last_alert_at || now - Date.parse(row.last_alert_at) > s.cooldown_minutes * 60000;
  let say = '';
  if (issue && (!was || row.alert_kind !== issue || cooled)) say = issue;
  else if (!issue && was) say = 'recovered';

  const changed = !row.workflow_id || row.workflow_name !== p.workflow_name || row.schedule !== p.schedule
    || (Number(row.max_gap_minutes) || null) !== p.max_gap_minutes || say;
  if (!changed) continue;
  out.push({ json: {
    workflow_id: p.workflow_id, workflow_name: p.workflow_name, schedule: p.schedule, max_gap_minutes: p.max_gap_minutes,
    alerting: !!issue, alert_kind: issue,
    last_alert_at: say && say !== 'recovered' ? new Date(now).toISOString() : (row.last_alert_at || null),
    say, line: issue ? line + link(p.workflow_id) : '',
    repeat: !!(say && was && row.alert_kind === say),
  } });
}
return out;
Connect a Data table node named Save the state to upsert each changed row by workflow_id. Mapping only the seven system columns leaves your manual tuning columns (override_gap_minutes, min_items, empty_runs_before_alert and enabled) untouched:
| Setting | Value |
|---|---|
| Resource | row |
| Operation | upsert |
| Data table | monitor_watch |
| Must match | All conditions |
| Condition: workflow_id | eq {{ $json.workflow_id }} |
| Column: workflow_id | {{ $json.workflow_id }} |
| Column: workflow_name | {{ $json.workflow_name }} |
| Column: schedule | {{ $json.schedule }} |
| Column: max_gap_minutes | {{ $json.max_gap_minutes }} |
| Column: alerting | {{ $json.alerting }} |
| Column: alert_kind | {{ $json.alert_kind }} |
| Column: last_alert_at | {{ $json.last_alert_at }} |
Connect a Code node named Build the message (with Execute Once on) to combine all findings from this 15-minute check into one Slack message, or return [] to stop the lane quietly when nothing needs reporting:
// One message for everything this run found. Nothing to say, no message.
const rows = $('Judge each workflow').all().map(i => i.json).filter(r => r.say);
if (!rows.length) return [];
const icon = { stalled: '🔴', failing: '🟠', empty: '🟡', recovered: '✅' };
const order = ['stalled', 'failing', 'empty', 'recovered'];
rows.sort((a, b) => order.indexOf(a.say) - order.indexOf(b.say));
const bad = rows.filter(r => r.say !== 'recovered');
const lines = rows.map(r => r.say === 'recovered'
  ? `${icon.recovered} *${r.workflow_name}* recovered`
  : `${icon[r.say]} *${r.workflow_name}* ${r.say}${r.repeat ? ' (still)' : ''}: ${r.line}`);
return [{ json: {
  title: bad.length ? `Workflow health: ${bad.length} issue${bad.length > 1 ? 's' : ''}` : 'Workflow health: recovered',
  body: lines.join('\n'),
} }];
Finish the lane with a Slack node named Post the health alert and a disabled Send Email node named Email the health alert wired to its error output. Both use the exact same settings, retry counts and error output configuration as Post the alert and Email the alert in Step 2, except they read Watch settings and send $json.title as the header/subject and $json.body as the section/email text:
{{ ({ blocks: [{ type: 'header', text: { type: 'plain_text', emoji: true, text: String($json.title).slice(0, 150) } }, { type: 'section', text: { type: 'mrkdwn', text: String($json.body).slice(0, 2900) } }, { type: 'context', elements: [{ type: 'mrkdwn', text: 'n8n workflow monitor · ' + $now.setZone($('Watch settings').first().json.timezone).toFormat('d LLL, h:mm a') }] }] }) }}Check: In monitor_watch, set override_gap_minutes to 1 on Publish new products and run Every 15 minutes by hand to receive a stalled alert. Clear override_gap_minutes back to null and run the lane again to receive the recovered message.
Step 6: Post a daily all-clear
A monitor that only speaks when something breaks looks identical to a monitor that has silently died. Posting a daily n8n health check at 08:00 makes silence itself a signal that something is wrong, and pairing it with an outbound heartbeat ping covers the case where your entire n8n server goes offline.
Start the Digest lane with a Schedule Trigger named Every morning (Trigger interval: Days, Trigger at hour: 8), which runs at 08:00 in your workflow’s configured timezone. Connect an Edit Fields (Set) node named Digest settings (with Include other input fields off):
| Setting | Value |
|---|---|
| slack_channel (string) | #n8n-alerts |
| alert_email (string) | [email protected] |
| from_email (string) | [email protected] |
| only_tag (string) | “ |
| ignore_tag (string) | no-monitor |
| heartbeat_url (string) | “ |
| keep_days (number) | 30 |
| timezone (string) | UTC |
Wire three data-gathering nodes in sequence, each with Execute Once enabled (and Always Output Data on the two Data table nodes):
- Data table
Get the last 24 hours of failures: Resourcerow, Operationget, Data tablemonitor_failures, Must matchAll conditions, Conditionfailed_atgt{{ $now.minus({ hours: 24 }).toISO() }}, Return allon. - Data table
Get the watch list: Resourcerow, Operationget, Data tablemonitor_watch, Return allon. - n8n
Get workflows for the digest: ResourceWorkflow, OperationGet Many, Return Allon, Filters > Return Only Active Workflowson, Filters > Tags{{ $('Digest settings').first().json.only_tag }}, Filters > Exclude Pinned Dataon(with Retry On Fail set to 3 tries, 5000 ms apart).
Connect a Code node named Build the digest (with Execute Once on). When no watched workflow is alerting and no failures happened in the past 24 hours, it outputs a one-line all-clear. Otherwise, it lists currently alerting workflows, groups the last 24 hours of failures by workflow (showing count, latest failure time, failing node and clipped error message), and finishes with a Not covered section. Because n8n has no instance-wide default error workflow setting, that Not covered check inspects every published workflow via the API and lists any workflow missing errorWorkflow, any workflow with saveDataSuccessExecution set to none (where stalls can’t be detected), and any watched workflow whose schedule couldn’t be parsed:
// Posts every day. All clear is one line; otherwise what's wrong, the day's failures, and what isn't covered.
const s = $('Digest settings').first().json;
const self = $workflow.id;
const fails = $('Get the last 24 hours of failures').all().map(i => i.json).filter(f => f && f.workflow_id !== undefined && f.id);
const watch = $('Get the watch list').all().map(i => i.json).filter(r => r && r.workflow_id);
const wfs = $('Get workflows for the digest').all().map(i => i.json).filter(w => w && w.id && w.id !== self
  && !(s.ignore_tag && (w.tags || []).some(t => t.name === s.ignore_tag)));
const live = new Set(wfs.map(w => String(w.id)));
const watched = watch.filter(r => r.enabled !== false && live.has(String(r.workflow_id)));
const alerting = watched.filter(r => r.alerting);
const icon = { stalled: '🔴', failing: '🟠', empty: '🟡' };
const clip = (t, n) => { t = String(t || '').replace(/\s+/g, ' '); return t.length > n ? t.slice(0, n - 1) + '…' : t; };

const groups = {};
for (const f of fails) {
  const g = groups[f.workflow_name] = groups[f.workflow_name] || { n: 0, last: f };
  g.n++; if (Date.parse(f.failed_at) > Date.parse(g.last.failed_at)) g.last = f;
}
const names = Object.keys(groups).sort((a, b) => groups[b].n - groups[a].n);
const noHandler = wfs.filter(w => !w.settings || w.settings.errorWorkflow !== self).map(w => w.name);
const noSaves = wfs.filter(w => w.settings && w.settings.saveDataSuccessExecution === 'none').map(w => w.name);
const noGap = watched.filter(r => !(Number(r.max_gap_minutes) > 0) && !(Number(r.override_gap_minutes) > 0)).map(r => r.workflow_name);

const lines = [];
let status = 'ok';
if (!alerting.length && !fails.length) {
  lines.push(`✅ *All clear*: ${watched.length} workflow${watched.length === 1 ? '' : 's'} watched, no failures in the last 24 hours.`);
} else {
  for (const r of alerting) lines.push(`${icon[r.alert_kind] || '🔴'} *${r.workflow_name}* is ${r.alert_kind}`);
  if (names.length) {
    if (alerting.length) lines.push('');
    lines.push(`*Failures in the last 24 hours* (${fails.length})`);
    for (const n of names.slice(0, 10)) {
      const g = groups[n], t = DateTime.fromISO(g.last.failed_at).setZone(s.timezone).toFormat('h:mm a');
      lines.push(`• *${n}*: ${g.n}×, last at ${t}${g.last.node_name ? ' in `' + g.last.node_name + '`' : ''}`);
      lines.push(`    _${clip(g.last.error_message, 160)}_`);
    }
    if (names.length > 10) lines.push(`• and ${names.length - 10} more`);
  }
  lines.push('', `_${watched.length - alerting.length} of ${watched.length} watched workflows are fine._`);
  status = alerting.length || names.some(n => groups[n].n >= 3) ? 'error' : 'warn';
}
const gaps = [];
if (noHandler.length) gaps.push(`${noHandler.length} published workflow${noHandler.length === 1 ? ' has' : 's have'} no error workflow: ${clip(noHandler.join(', '), 300)}`);
if (noSaves.length) gaps.push(`not saving successful runs, so stalls can't be seen: ${clip(noSaves.join(', '), 200)}`);
if (noGap.length) gaps.push(`schedule not understood, set override_gap_minutes: ${clip(noGap.join(', '), 200)}`);
if (gaps.length) lines.push('', '*Not covered*', ...gaps.map(g => '• ' + g));
const head = { ok: '✅', warn: '🟡', error: '🔴' }[status];
return [{ json: { title: `${head} n8n daily health`, body: lines.join('\n').trim(), status } }];
Connect Build the digest to Post the digest (Slack) and Email the digest (Send Email, disabled), configured just like Watch’s alert nodes but reading Digest settings. Wire both the main output of Post the digest and the output of Email the digest to an If node named Heartbeat set? (with Execute Once on):
| Setting | Value |
|---|---|
| Value 1 | {{ !!$('Digest settings').first().json.heartbeat_url }} |
| Operator | boolean true |
| Value 2 | “ |
Connect the true output (output 0) to an HTTP Request node named Ping the heartbeat (Method: GET, URL: {{ $('Digest settings').first().json.heartbeat_url }}, Options > Timeout: 10000, with Retry On Fail set to 3 tries, 5000 ms apart and On Error: Continue). When you paste a check URL from Healthchecks.io into Digest settings, Healthchecks.io expects a ping every morning and emails you itself if your n8n container or VM goes down.
Finally, wire both Ping the heartbeat and the false output (output 1) of Heartbeat set? to a Data table node named Delete old failures, then connect it to Delete old runs (both with Execute Once and Always Output Data on) to keep your tables well inside n8n’s default 200 MiB Data Tables storage limit:
| Node | Data table | Condition |
|---|---|---|
Delete old failures | monitor_failures (Operation: deleteRows) | failed_at lt {{ $now.minus({ days: $('Digest settings').first().json.keep_days }).toISO() }} |
Delete old runs | monitor_runs (Operation: deleteRows) | ran_at lt {{ $now.minus({ days: $('Digest settings').first().json.keep_days }).toISO() }} |
Check: Run Every morning by hand and confirm that Slack receives your daily health post (including any workflows under Not covered that haven’t had their error workflow set yet).
What it costs
Watch uses one execution per run regardless of how many workflows it inspects (2,880 executions a month at 15-minute intervals, or 720 a month if you change Every 15 minutes to hourly). Digest uses 30 executions a month, Catch runs once per failure that gets past Retry On Fail, sub-workflow calls to Log a run don’t count towards Cloud execution limits, and n8n API calls don’t count as executions. Because the monitor shares your monthly execution allowance with the workflows it watches, here is how it fits across plans (checked November 2026):
| Item | Watch every 15 minutes | Watch hourly |
|---|---|---|
| n8n self-hosted | Free | Free |
| n8n Cloud | Pro, €50 a month (about 2,910 plus failures, of 10,000) | Starter, €20 a month (about 750 plus failures, of 2,500) |
| Slack | Free plan works | Free plan works |
| Email fallback | Free with an SMTP account you already have | Same |
| Heartbeat (Healthchecks.io) | Free, 20 checks | Free |
| Chat model | None in this template | None |
To keep execution counts low on n8n Cloud, switch Every 15 minutes to run hourly, turn on Retry On Fail on your external API nodes so temporary blips never reach Catch, and add the Log a run call only to workflows where a zero-item run is a real problem.
Common mistakes
Alerting on every failure
Sending a message every time a 5-minute workflow hits a rate limit produces dozens of identical pings in an hour and trains your team to mute the channel. Save every failure to monitor_failures, alert once per cooldown in Catch, let Watch report the error burst, and send a recovery line when it clears.
Testing the error workflow with a manual run
Clicking Execute workflow in the editor never triggers n8n’s Error Trigger node, even when the run ends in red. Always test your error workflow by enabling a scheduled trigger such as Every 5 minutes (demo) and publishing the workflow.
Turning on the error output with nothing wired to it
Setting a node’s On Error option to Continue (using error output) without connecting a downstream node to that second output silently discards the error and marks the execution green. Either wire the error output to a handler or leave On Error set to Stop Workflow so Catch receives the crash.
Forgetting the error workflow setting on new workflows
New workflows don’t inherit an error workflow automatically, which means a newly published automation will fail in silence until someone links it. Check the Not covered section of your morning digest to spot published workflows that still need Settings > Error workflow set.
Not saving successful production executions or pruning too aggressively
If a watched workflow has Save successful production executions set to Do not save, or if your instance prunes execution history after 24 hours while a workflow runs once a week, the n8n API will see zero recent runs and flag the workflow as stalled. Keep execution retention longer than your longest schedule gap and check the digest’s Not covered list for workflows that don’t save successful runs.
Building a monitor that only speaks on failure
If your alert channel is completely quiet for a week, you have no way to tell whether every workflow is healthy or your Slack token expired on Monday. Post the daily 08:00 all-clear and set a heartbeat_url so silence is immediately obvious.
Alerting into the channel that’s down
If your error workflow tries to post to Slack before recording the failure and Slack’s API is down, you lose both the notification and the record of the crash. Always insert the row into monitor_failures first, and enable the three SMTP fallback nodes if you want email delivery when Slack fails.
Letting the n8n API key expire
New n8n API keys default to a 30-day expiration, and when the key expires both Watch and Digest will fail. Catch will alert you when Watch fails, so pick a longer expiration or no expiration when creating the key.
Make it your own
Actionable alerts
You can add Retry, Snooze and Mute buttons directly to the Slack alerts so you can re-run a failed execution or silence a noisy workflow without opening n8n. Follow the guide on Slack approvals with n8n and Block Kit to wire interactive Block Kit buttons back to an n8n webhook.
Other channels
If your team doesn’t use Slack, replace Post the alert, Post the health alert and Post the digest with the Microsoft Teams, Telegram, Discord or PagerDuty node, sending the same text. For a solo instance where you only want email, delete the three Slack nodes and enable the three Send Email nodes.
Watch a second instance
Point the n8n API credential on Get published workflows, Get recent executions and Get workflows for the digest at another n8n instance’s URL and API key. Running the monitor on a second instance means neither instance is responsible for watching itself.
Business checks
Your morning digest doesn’t have to stop at execution status. Query your database or store API before Build the digest to append a line checking whether orders were imported in the last 24 hours or whether today’s supplier feed file updated on disk.
FAQ
Does n8n have built-in error notifications?
n8n doesn’t send email or chat alerts out of the box when a workflow fails; instead, it provides the Error Trigger node so you can build your own notification workflow. Cloud Pro and Enterprise, and self-hosted Business and Enterprise, also include the Insights dashboard to view failure rates in the UI, and alerts are something you build, usually as an error workflow like the one in this guide, which is how most n8n monitoring works.
Can I set one error workflow for every workflow at once?
No, n8n sets the error workflow per workflow under Workflow Settings > Error workflow, and one error workflow can be selected by as many workflows as you like. To make sure you never miss one, the morning digest in this guide automatically lists any published workflow on your instance that doesn’t have its error workflow set yet.
Will this work on n8n Cloud?
Yes, this setup works on any paid n8n Cloud plan (Starter or Pro) as well as self-hosted Community Edition. It won’t run during the n8n Cloud free trial because access to the n8n public API is disabled on trial accounts.
What about webhook workflows that don’t run on a schedule?
Webhook workflows are still covered by the Catch lane whenever an execution fails, and Work out the schedules skips them by default so Watch doesn’t flag them as stalled when traffic is quiet. If you have a webhook workflow that should always fire at least once a day (such as a daily order webhook), add a row for its workflow_id in monitor_watch and set override_gap_minutes to 1440.
What if n8n itself is down?
If the n8n process or server goes offline, no workflow on the instance can run to send an alert. Pinging an external service such as Healthchecks.io from Ping the heartbeat at the end of every morning digest ensures an outside server emails you as soon as the daily ping fails to arrive.
Next steps
Import the template into your n8n instance, fill in your Slack channel and n8n_url in the three settings nodes, and run Run once to set up to create the Data Tables. Publish the monitor, set it as the Error workflow on one production workflow, and enable Every 5 minutes (demo) for ten minutes to watch the first alert and cooldown work end to end.